There are several ways it add a TeHyBug to your HomeAssistant.
1. Embed a public graph to your dashboard.
2. Add it as an MQTT Sensor to your Homeassistant.
Usually, Home Assistant is installed on a Raspberry Pi or similar devices.
If you don’t have an MQTT Brocker, here is the instruction on how to install the MQTT Broker on your PI.
https://randomnerdtutorials.com/how-to-install-mosquitto-broker-on-raspberry-pi/
- Put your TeHyBug into a configuration mode.
- open HTTP://192.168.1.1 in your browser (Firefox works best)
- Configure WIFI Connection by providing your WIFI Credentials.
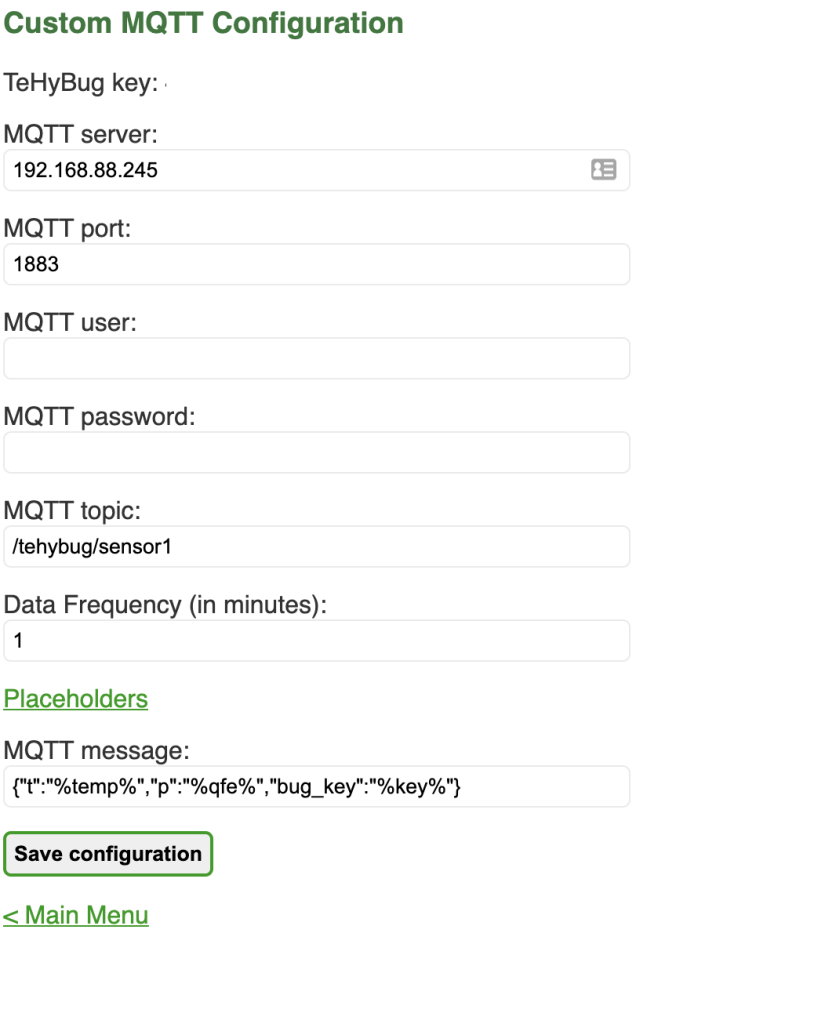
- Go to Custom MQTT Configuration and fill the required fields similar to the screenshot below, the MQTT Server should be the IP Address of your MQTT Broker
- Save, activate the live mode and restart the TeHyBug.
- Make sure mqtt block in the configuration exists, if not please configure it a your home assistant integration. Open the configuration.yaml file of your home assistant and add a sensor block, if the sensor block exists, just extend it:
Example configuration.yaml entry:
sensor:
  - platform: mqtt
    name: "Temperature Test"
    state_topic: "/tehybug/sensor1"
    unit_of_measurement: "°C"
    value_template: "{{ value_json.t }}"
  - platform: mqtt
    name: "Pressure Test"
    state_topic: "/tehybug/sensor1"
    unit_of_measurement: "hPa"
    value_template: "{{ value_json.p }}"
After this, you will be able to add a new sensor entity to your dashboard.
Leave a Reply