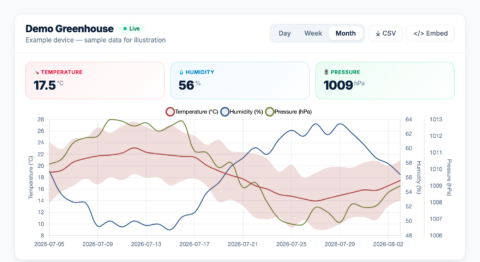
Your TeHyBug is only half the story — the other half is what tehybug.com does with the readings once they arrive. A lot has been added recently, so here is the full tour: a brand-new MQTT server, custom sensor parameters, smarter charts, alerts that reach you wherever you are, and embeddable live graphs for your own site.
📡 New: send your data over MQTT
Until now devices reported over HTTP. You can now publish readings to the TeHyBug MQTT broker instead — handy if your setup already speaks MQTT, or if you want a persistent connection rather than one request per reading.
| Broker | mqtt.tehybug.com |
| Port | 8883 (TLS, recommended) or 1883 (plain) |
| Topic | tehybug/<your-username>/<device-key>/data |
| Auth | Your own account username and password |
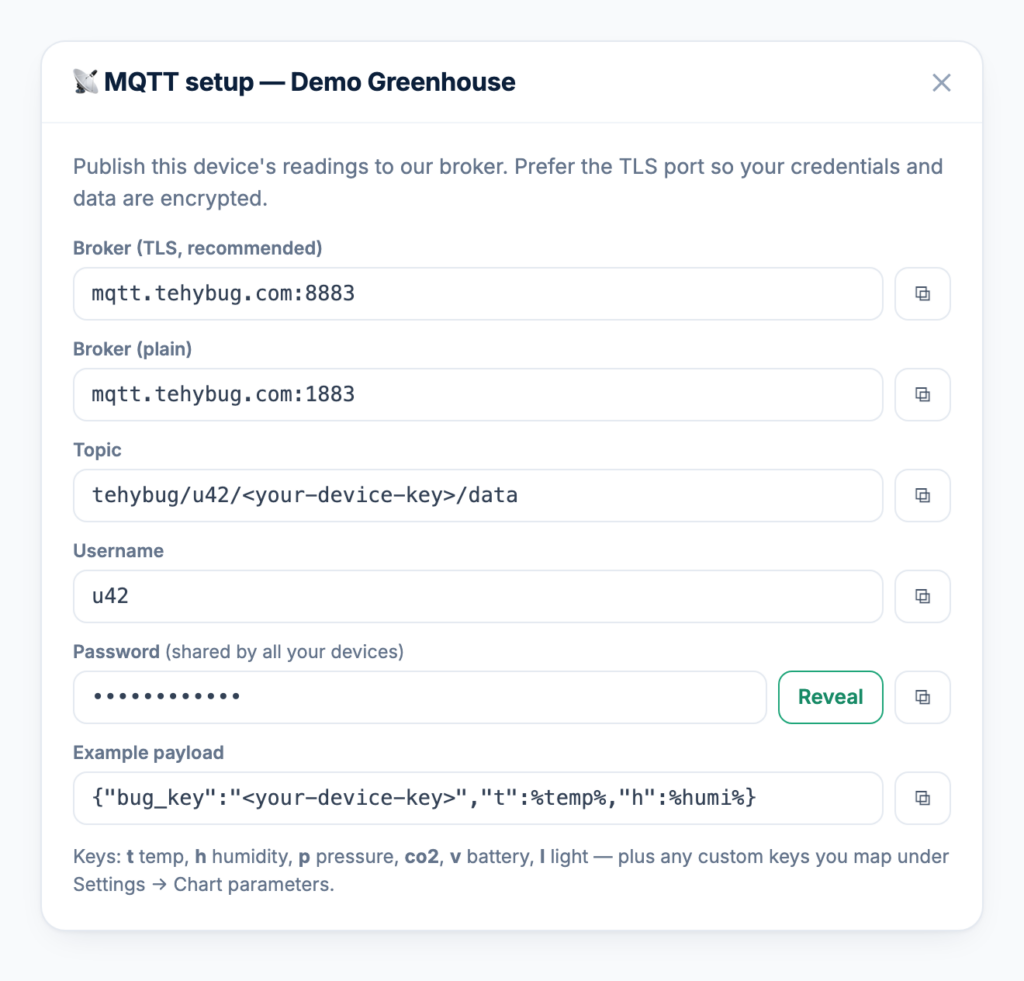
You will find your credentials, your device’s exact topic and a ready-to-copy payload on the dashboard: open a device and press the MQTT button. The password is hidden until you press Reveal, and every field has a copy button.
The payload is the same JSON your device already sends over HTTP. On TeHyBug firmware you can use its template tokens, which the device replaces with live values before sending:
{"bug_key":"<your-device-key>","t":%temp%,"h":%humi%}A few things worth knowing about how it is secured:
- Every account gets its own broker login — there is no shared password.
- You can only publish inside your own
tehybug/<your-username>/…namespace. - Even within your namespace, a reading is only accepted for a device that actually belongs to you.
- Use port 8883 so your credentials and readings are encrypted in transit.
Buttons and relays work the same way — just swap bug_key for button_key or relay_key.
🎛️ Chart any sensor value you like
TeHyBug charts temperature, humidity and pressure out of the box, but your device can send anything — CO₂, VOC, soil moisture, battery voltage, a value from a sensor you wired up yourself. Those extra values used to be stored but never drawn.
Now you can map them. Open a device → Settings → Chart parameters, and you will see the data keys your device is actually sending, detected from its latest reading and offered as one-click chips. Click a key, give it a display name and a unit (for example co2 → “CO₂”, ppm), and it gets its own line and its own axis on the chart, plus a column in the data table and the CSV export.
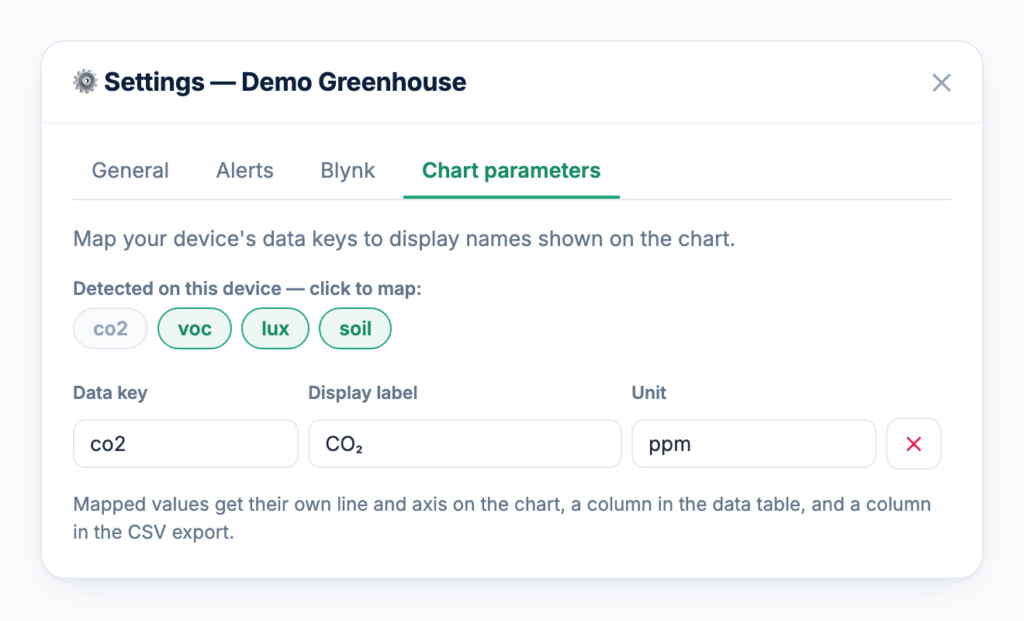
No more remembering which raw key you used in your firmware — the dashboard tells you.
📈 Charts that show the whole picture
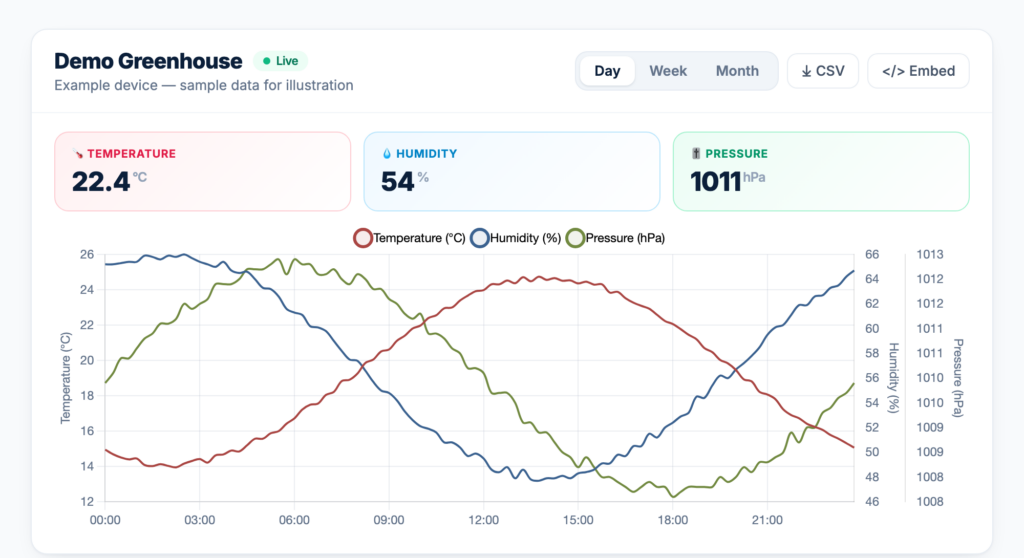
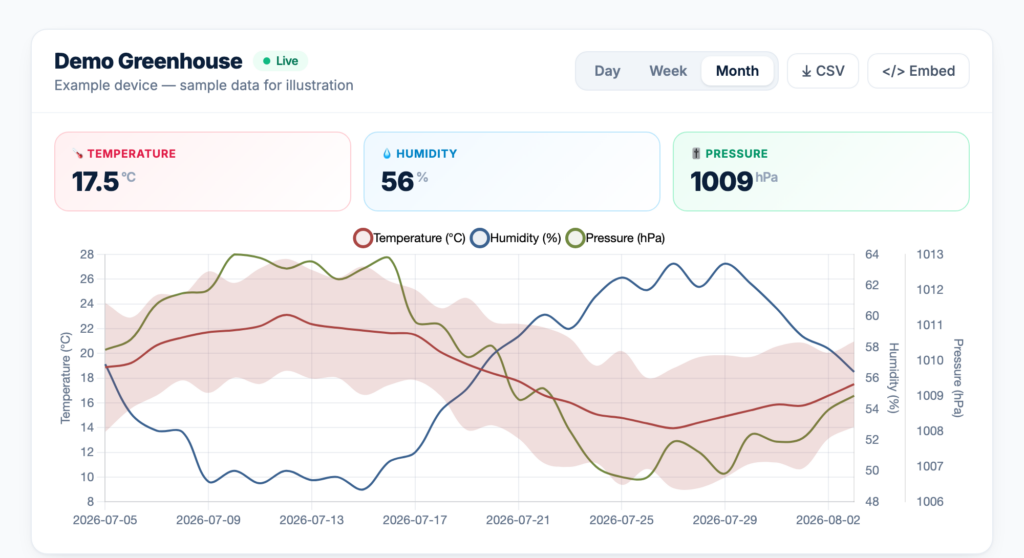
- Day, Week and Month ranges. Day shows every raw sample; Week averages by hour; Month averages by calendar day, in your device’s own timezone.
- Min/max bands. An average can hide a lot — a freezer that spiked for an hour looks fine as a daily mean. Week and Month charts now draw a shaded band between the lowest and highest temperature in each bucket, so spikes stay visible.
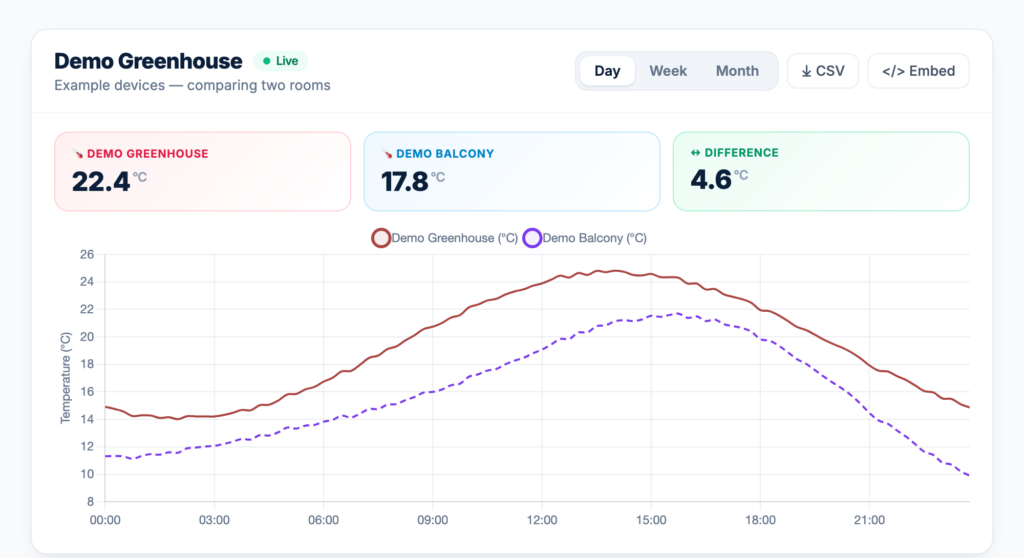
- Compare two devices on one chart to see indoor vs outdoor, or two rooms, on the same axes.
- CSV export of exactly what you are looking at, for your own spreadsheets.
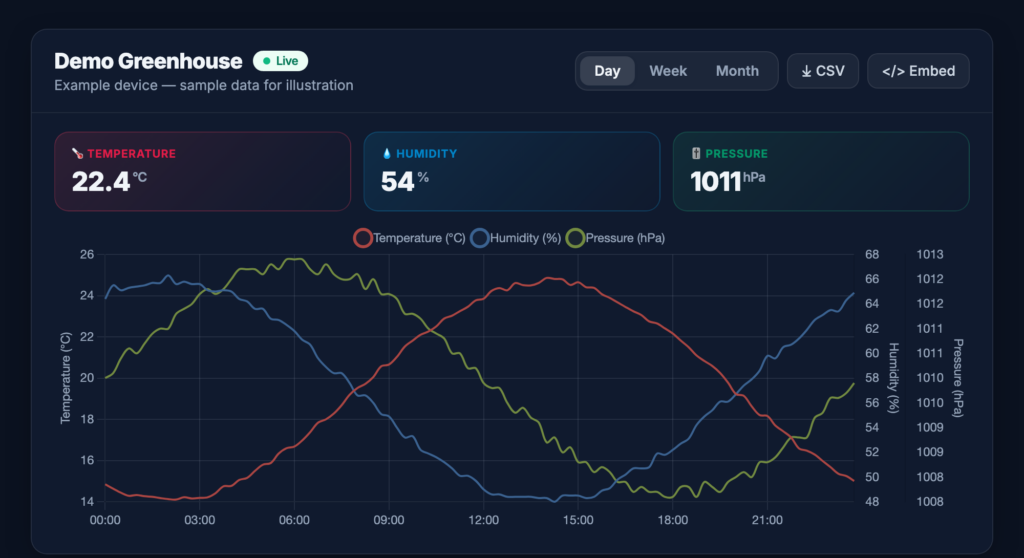
- Dark mode across the whole site, charts included.
🔔 Alerts that actually reach you
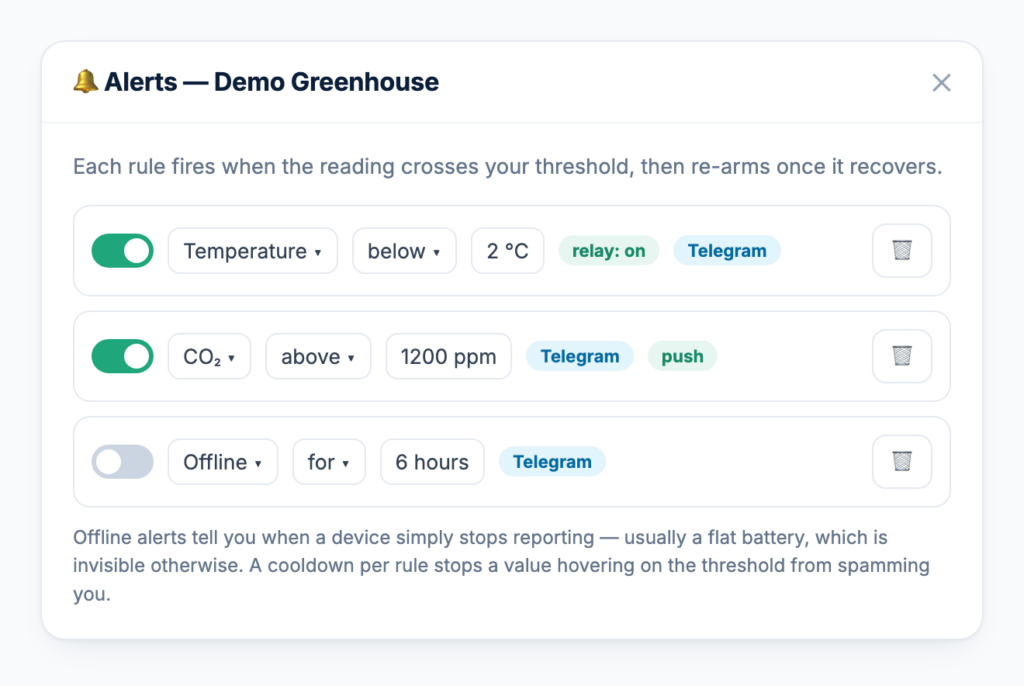
Set a rule per device — “temperature below 2 °C”, “CO₂ above 1200 ppm”, “humidity above 70%” — and choose how you hear about it:
- Telegram via the TeHyBug bot, email, or browser push notifications.
- Offline alerts — get told when a device simply stops reporting for a number of hours. Often the most useful alert of all: a flat battery is invisible otherwise.
- Cooldown per rule, so a value hovering on the threshold does not spam you.
- Relay automation — a rule can switch a TeHyRelay on or off, turning a sensor reading into an action (heater, fan, pump).
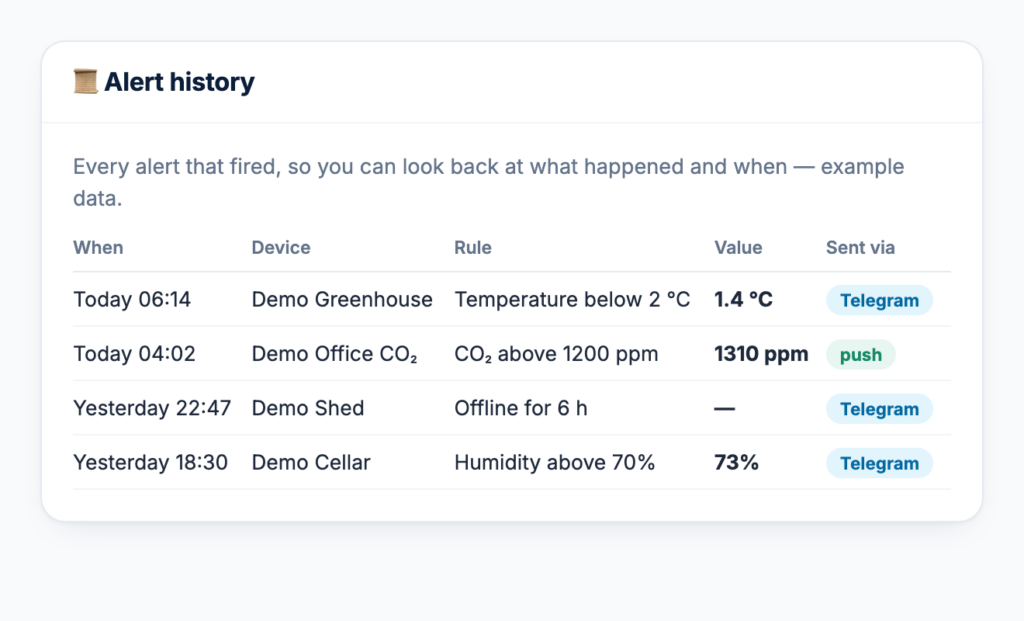
- Alert history so you can look back at what fired and when.
- Rules can be switched off individually without deleting them.
🔗 Share a device, or embed it in your own site
Every device can have a public page with a live chart, on a link you choose to share — no login needed for whoever you send it to.
Press Embed on that page and you get a small builder that writes the <iframe> for you. You can pick:
- Layout — the full page, the graph only, or a compact readings tile.
- Which parts to hide — the latest-readings tiles, the title, the toolbar.
- Theme — auto, light or dark, so it matches the site you are pasting it into.
- Default range and the frame height.
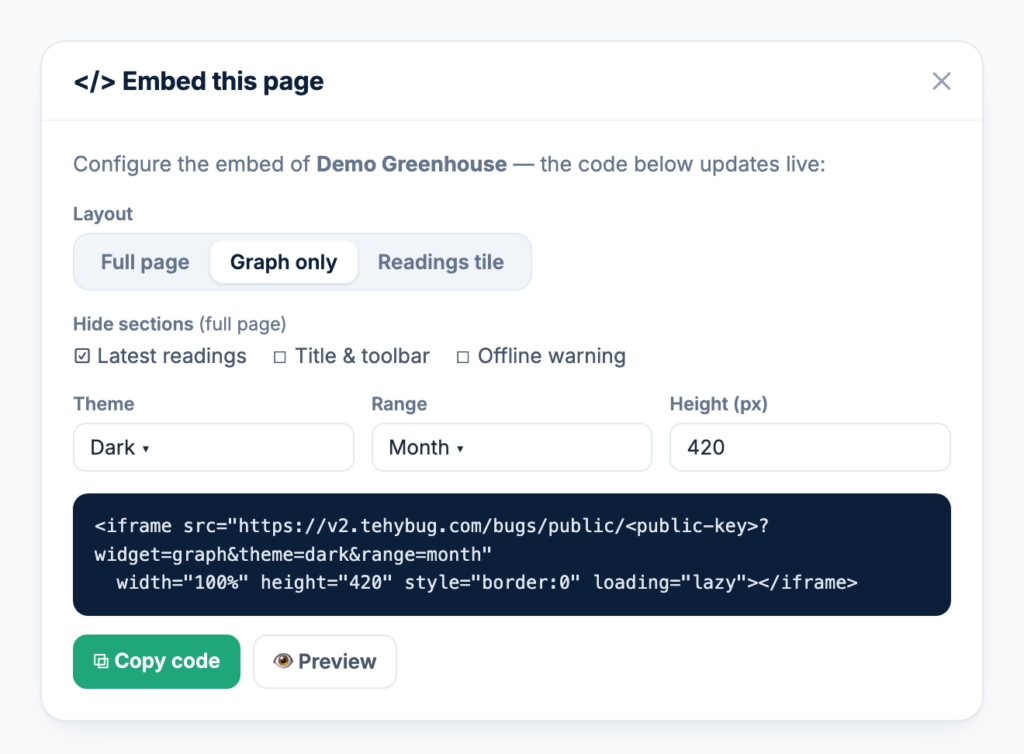
The snippet updates live as you change the options, and there is a preview link to check it before you paste.
📱 On your phone
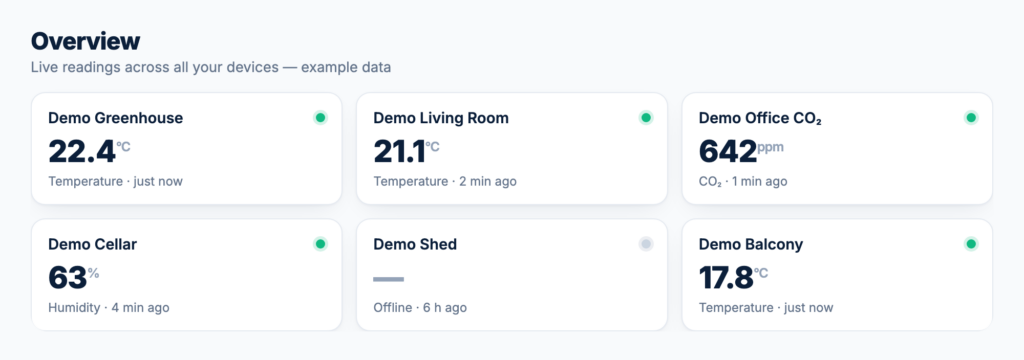
- Overview page with live tiles for every device — the fastest way to see everything at once.
- Add to Home Screen on iOS or Android for a one-tap app icon that opens straight into that overview.
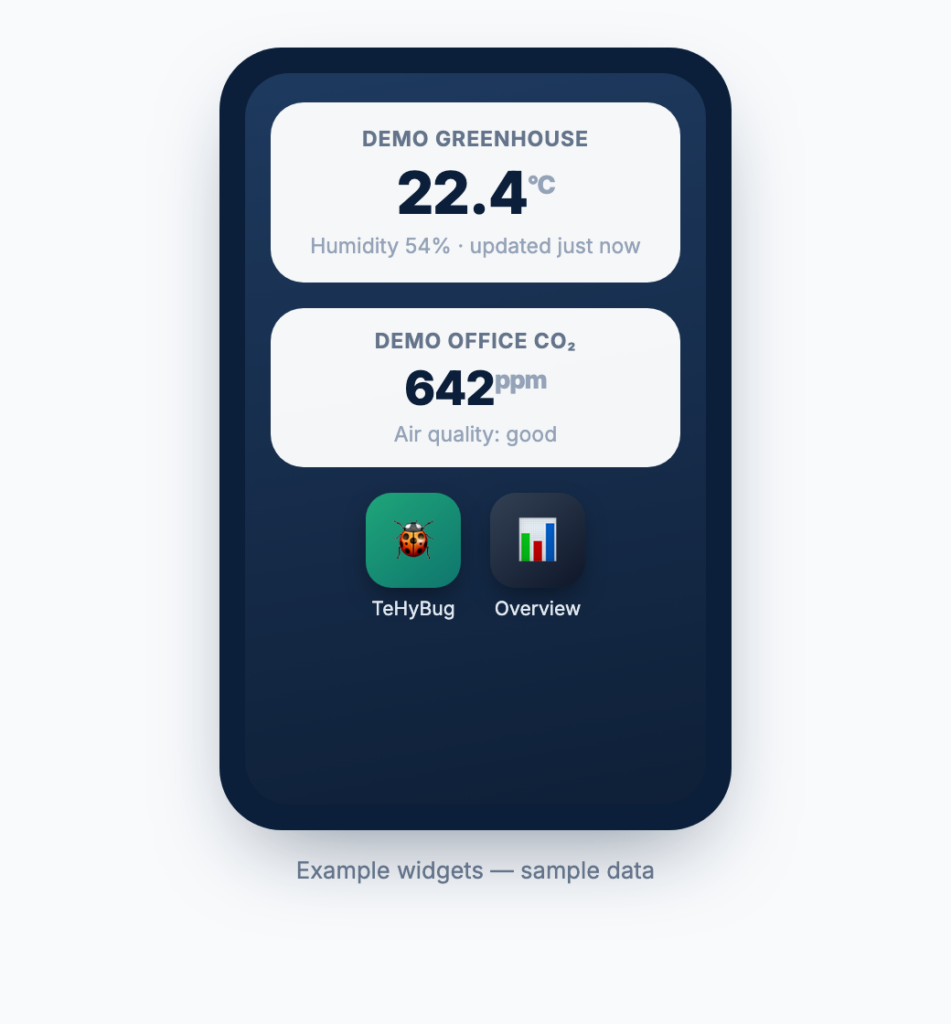
- iOS widgets via the free Scriptable app — one script reads a device directly on your home WiFi, another works from anywhere using a device’s public key.
🔌 Relays and buttons
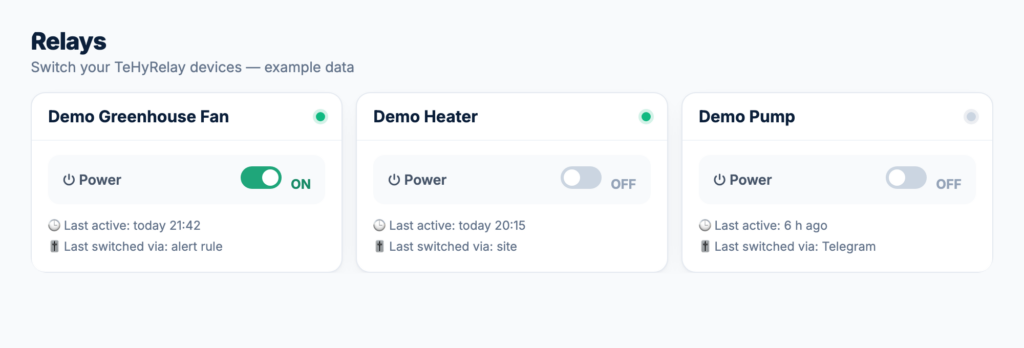
Relays have their own dashboard now: switch each one on or off from the site, see whether it is online and when it was last switched — and by what, since a relay can be flipped from the dashboard, from Telegram, or automatically by an alert rule.
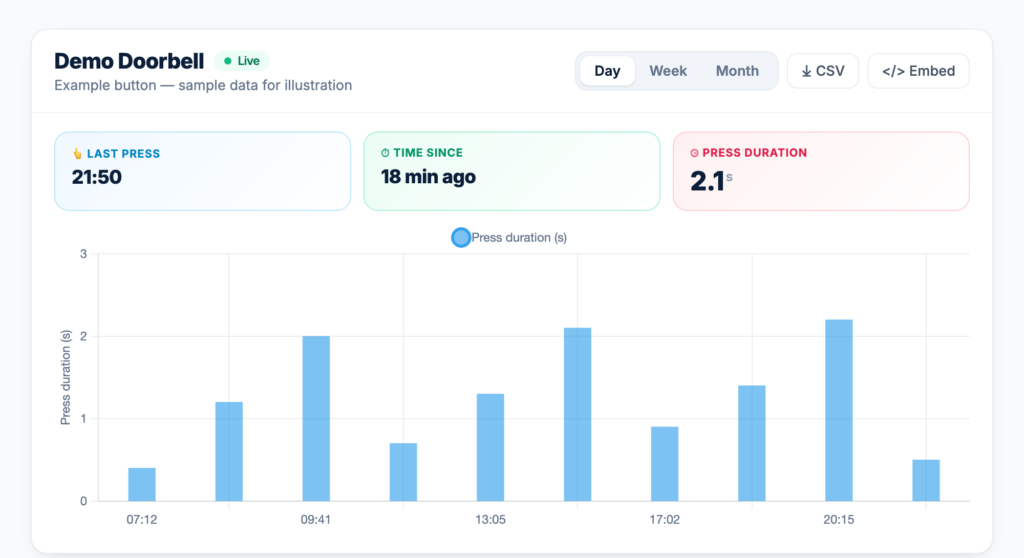
TeHyButtons get the same treatment as sensors: press history, press duration charts, public pages and MQTT.
💬 Help when you need it
There is an AI support assistant in the corner of every page that knows the TeHyBug device range, the firmware and the common problems. If it cannot help, logged-in users can open a support ticket and get a reply by email. The FAQ covers setup, flashing, calibration, deep sleep and MQTT in more depth.
Where to start
If you have a TeHyBug already, open your dashboard and try three things: press MQTT on a device to see your broker details, open Settings → Chart parameters to map any custom values your device sends, and switch a chart to Month to see the new min/max band.
If you do not have one yet, the FAQ is the best place to see what the devices can do.
Leave a Reply